Performance Optimization
Recommended Tools
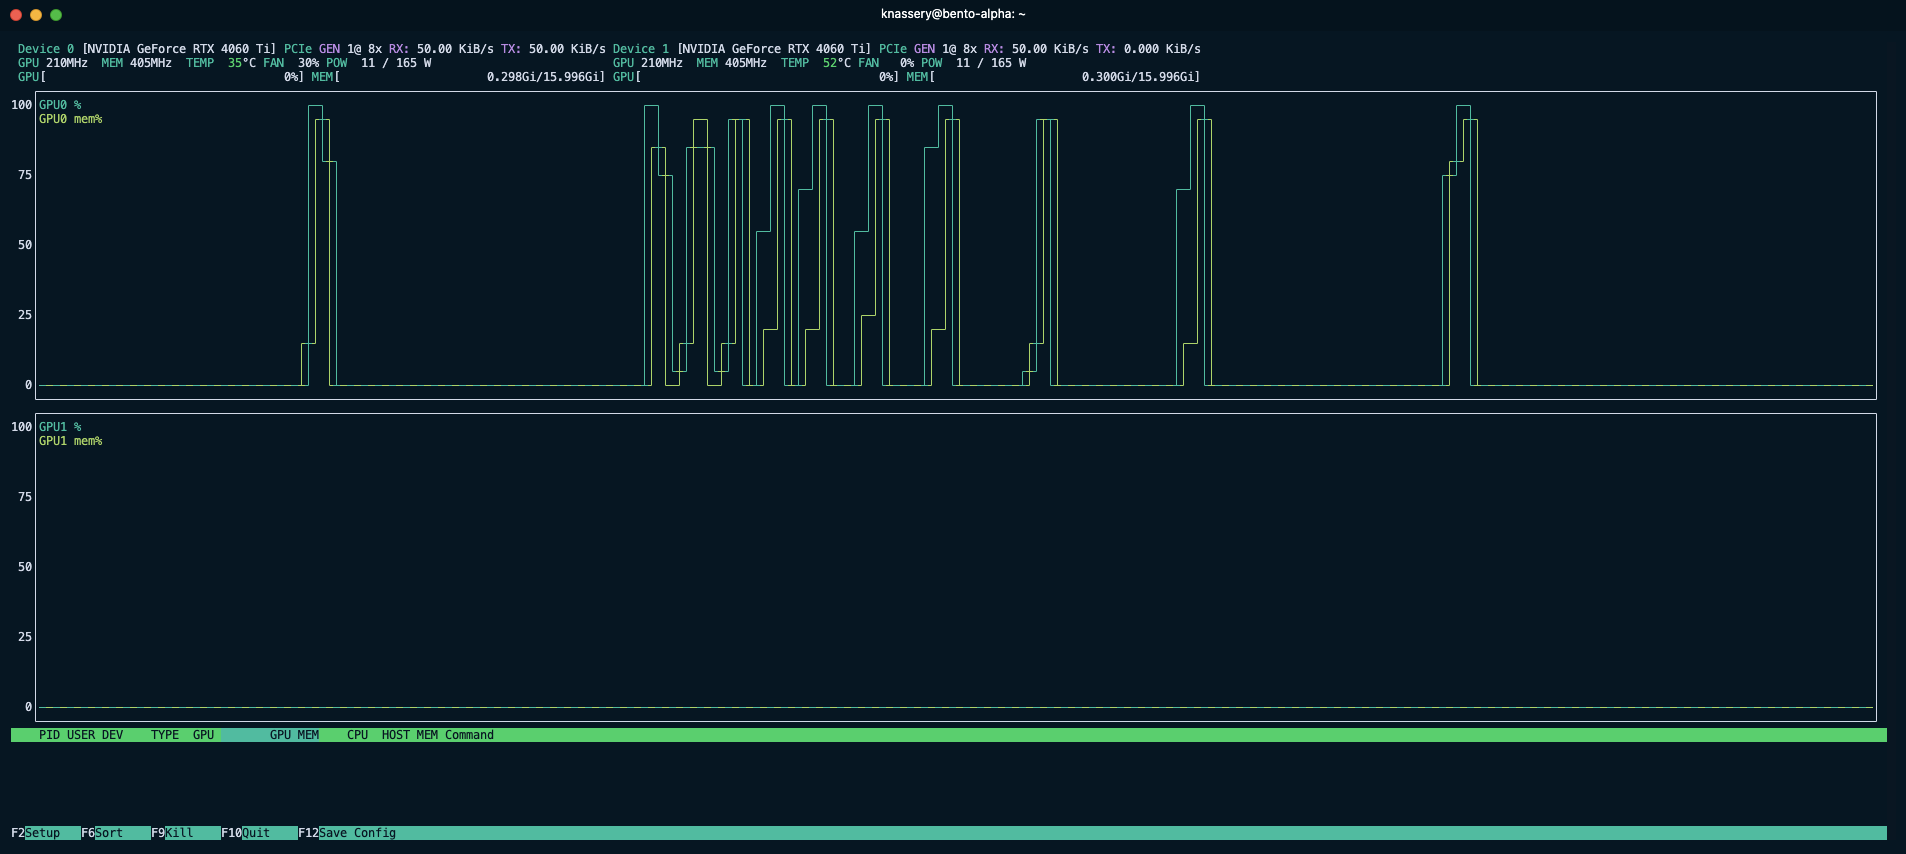
We recommend the following tools to monitor performance and resource use:
- nvtop - A tool to monitor GPU utilization.
- htop - A tool to monitor CPU utilization, system memory, and process status.
Both of these tools warrant a decent size terminal window on your desktop to monitor the performance during experiments.
Build Configuration
The NVCC_APPEND_FLAGS Docker build arg (found in compose.yml -> services -> exec_agent -> build -> args) should be set to match your specific GPU architecture, a good reference for GPU -> SM version can be found here.
You can also adjust the CUDA optimization level via CUDA_OPT_LEVEL in the exec_agent build args. A value of 3 might yield slightly better performance (a few %) but at the cost of much longer build times.
Testing
Isolating Tests
Operating competing workloads can lead to unpredictable results. We recommend isolating your test system from other workloads to ensure that the performance tuning results are consistent and reliable. This includes stopping configured Broker services:
docker ps
docker stop <BROKER_CONTAINER_ID>Alternatively you can modify your scripts/boundless_service.sh to remove --profile broker.
start_services() {
# Trap SIGINT (Ctrl-C) and SIGTERM to execute cleanup
trap cleanup SIGINT SIGTERM
log_info "Starting Docker Compose services using environment file: $ENV_FILE"
# Start Docker Compose in foreground mode
docker compose --profile broker --env-file "$ENV_FILE" up --build -d
docker compose --env-file "$ENV_FILE" up --build -d
# After docker compose up exits normally (without interruption)
log_success "Docker Compose services have been started."
}Defining a Test Harness
It is recommended to benchmark using an example of your actual workload. Using a representative workload will provide more accurate turn around times, and validate your ELF and inputs file for the proofs you plan to generate.
To try a realistic example:
RUST_LOG=info cargo run --bin bento_cli -- -f /path/to/elf -i /path/to/input`If you intend to operate across a variety of different workloads (such as those that may be fed by the Broker), you can also use the following command to generate a synthetic workload:
RUST_LOG=info cargo run --bin bento_cli -- -c <ITERATION_COUNT>where <ITERATION_COUNT> is the number of times the synthetic guest is executed. A value of 4096 is a good starting point, however on smaller or less performant hosts, you may want to reduce this to 2048 or 1024 while performing some of your experiments. For functional testing, 32 is sufficient.
The typical test process will be:
- Start
nvtopandhtop - Execute the test harness above and copy the job id
- Upon completion of the job use the
script/job_status.shto view the results
Example test run of 1024 iterations:
RUST_LOG=info cargo run --bin bento_cli -- -c 10242024-10-17T15:27:34.469227Z INFO bento_cli: image_id: a0dfc25e54ebde808e4fd8c34b6549bbb91b4928edeea90ceb7d1d8e7e9096c7 | input_id: 3740ebbd-3bef-475f-b23d-6c2bf96c6551
2024-10-17T15:27:34.479904Z INFO bento_cli: STARK job_id: 895a996b-b0fa-4fc8-ae7a-ba92eeb6b0b1
2024-10-17T15:27:34.480919Z INFO bento_cli: STARK Job running....
....
2024-10-17T15:27:56.509275Z INFO bento_cli: STARK Job running....
2024-10-17T15:27:58.513718Z INFO bento_cli: Job done!echo 895a996b-b0fa-4fc8-ae7a-ba92eeb6b0b1 | bash scripts/job_status.sh jobs_count
------------
19
(1 row)
remaining_jobs
----------------
0
(1 row)
task times:
task_id | task_type | state | wall_time | started_at
---------+-----------+-------+-----------+----------------------------
init | Executor | done | 0.530216 | 2024-10-17 15:27:35.00974
0 | Prove | done | 3.299771 | 2024-10-17 15:27:35.661319
1 | Prove | done | 3.129968 | 2024-10-17 15:27:35.818467
3 | Prove | done | 2.998964 | 2024-10-17 15:27:38.963914
2 | Join | done | 1.123467 | 2024-10-17 15:27:38.9684
4 | Prove | done | 2.901972 | 2024-10-17 15:27:40.105599
7 | Prove | done | 3.001664 | 2024-10-17 15:27:41.977001
5 | Join | done | 1.237363 | 2024-10-17 15:27:43.022033
6 | Join | done | 1.154148 | 2024-10-17 15:27:44.273276
8 | Prove | done | 3.096732 | 2024-10-17 15:27:44.992537
(10 rows)
Effective Hz:
hz | total_cycles | elapsed_sec
---------------------+--------------+-------------
399385.599822715909 | 8650752 | 21.660150
(1 row)In the final table, the effective Hz is the primary metric for consideration. This represents the (number of cycles) / (elapsed wallclock time). In the example above, the effective Hz is roughly 400kHz.
Finding the Maximum SEGMENT_SIZE for GPU VRAM
We will start by optimizing the GPU workers. This is because the bulk of the RISC Zero workload is executed by the gpu-agent and GPU resources are most often the performance bottleneck.
What is the Segment Size?
An important concept to understand for testing is RISC Zero's continuations. Continuations are the key mechanism that allow RISC Zero's zkVM to scale to effectively handle arbitrarily large proofs.
The CPU first runs the workload in a pre-flight stage where it doesn't engage in proving, while doing so it divides the program trace into a series of segments. In Bento ,these segments are then dispatched to various workers for proving, and are combined back together in the final stage to produce the proof.
The key tuning parameter of continuations is SEGMENT_SIZE in the .env-compose file. A proof is divided into (2^SEGMENT_SIZE) sized segments. The default value is 20, which means that a proof is composed of the number of required segments of approximately 1M cycles (2^20 = 1048576).
SEGMENT_SIZE has some practical implications, related to GPU VRAM capacity. Below is a set of guidelines for setting SEGMENT_SIZE maximums:
| VRAM | SEGMENT_SIZE Max |
|---|---|
| 8GB | 19 |
| 16GB | 20 |
| 20GB | 21 |
Testing the GPU has enough memory to handle the Segment Size
Once you have selected a MAXIMUM segment size you should verify that the GPU does in fact have enough memory to complete.
In the following test, an RTX 4060 with 16GB VRAM attempts to run with a SEGMENT_SIZE of 21, which is too large for the GPU to handle. In this test, it is necessary to monitor the gpu-agent Docker logs to determine the cause of the failure.
RUST_LOG=info cargo run --bin bento_cli -- -c 40962024-10-17T15:58:15.205138Z INFO bento_cli: image_id: a0dfc25e54ebde808e4fd8c34b6549bbb91b4928edeea90ceb7d1d8e7e9096c7 | input_id: fe7f4251-25f4-436f-b782-f134d4c80538
2024-10-17T15:58:15.210646Z INFO bento_cli: STARK job_id: bbf442eb-40db-44fb-8df4-f13a8ce10bf2
2024-10-17T15:58:15.211686Z INFO bento_cli: STARK Job running....
....We then examine the gpu-agent logs and see a series of out of memory errors:
docker logs bento-gpu_agent02024-10-17T15:57:43.667484Z INFO workflow::tasks::prove: Starting proof of idx: 6f95e238-d0be-4e94-9e81-fefdc0b7d8c4 - 1
thread 'main' panicked at /usr/local/cargo/registry/src/index.crates.io-6f17d22bba15001f/risc0-zkp-1.1.1/src/hal/cuda.rs:206:61:
called `Result::unwrap()` on an `Err` value: OutOfMemory
stack backtrace:
0: rust_begin_unwind
at ./rustc/129f3b9964af4d4a709d1383930ade12dfe7c081/library/std/src/panicking.rs:652:5
1: core::panicking::panic_fmt
at ./rustc/129f3b9964af4d4a709d1383930ade12dfe7c081/library/core/src/panicking.rs:72:14
2: core::result::unwrap_failed
at ./rustc/129f3b9964af4d4a709d1383930ade12dfe7c081/library/core/src/result.rs:1654:5Indicating that the GPU is out of memory. In this case, the SEGMENT_SIZE should be reduced.
How to Benchmark an Individual GPU's SEGMENT_SIZE
Configure a Single GPU Instance
gpu_agent0: &gpu
image: agent
runtime: nvidia
pull_policy: never
restart: always
depends_on:
- postgres
- redis
- minio
mem_limit: 4G
cpu_count: 4Verify that No Other GPU Definitions Are Present in the Compose File
Confirm the SEGMENT_SIZE Is Set to the Maximum as Determined Above in the .env-compose File
Execute the Test Harness
RUST_LOG=info cargo run --bin bento_cli -- -c 4096Confirm Single GPU Utilization Using nvtop
Monitoring Bento with nvtop
Review the Effective Hz
echo <JOB_ID> | bash scripts/job_status.sh....
Effective Hz:
hz | total_cycles | elapsed_sec
---------------------+--------------+-------------
264892.074666431500 | 34603008 | 130.630590
(1 row)Here we see that our single gpu-agent at max SEGMENT_SIZE is able to achieve an effective 264kHz.
Multiple Agents and GPUs
We can incorporate multiple GPUs into a configuration. In this example, we have two 16GB GPU as that proved to be optimal above:
....
gpu_agent0: &gpu
image: agent
runtime: nvidia
pull_policy: never
restart: always
depends_on:
- postgres
- redis
- minio
....
gpu_agent1:
<<: *gpu
deploy:
resources:
reservations:
devices:
- driver: nvidia
device_ids: ['0']
capabilities: [gpu]
gpu_agent2:
<<: *gpu
deploy:
resources:
reservations:
devices:
- driver: nvidia
device_ids: ['1']
capabilities: [gpu]
gpu_agent3:
<<: *gpu
deploy:
resources:
reservations:
devices:
- driver: nvidia
device_ids: ['1']
capabilities: [gpu]
....Here are the effective results on our example system:
431375.207834042771 | 35127296 | 81.430957In this case, we see that the effective Hz has increased to 431kHz, which is a significant improvement over the single GPU configuration; however we anticipated if the system was GPU limited we could expect 264Hz * 2 = 528Hz.
This means that our example system is bound by some other factor such as bus bandwidth, memory, etc.
Some further suggestions:
- Reconfigure the system back to higher
PO2with single agent per GPU and establish a new baseline performance level to compare against. - For lower
SEGMENT_SIZEconfigurations, experiment withcpu_countandmem_limit(removing, increasing, or decreasing) to see if the performance can be improved. - In cases where bus contention is the limiting factor, running fewer agents at higher maximum
SEGMENT_SIZEmay be optimal. Systems in this configuration should avoid GPU expansion, and instead opt to expand into remote workers.